
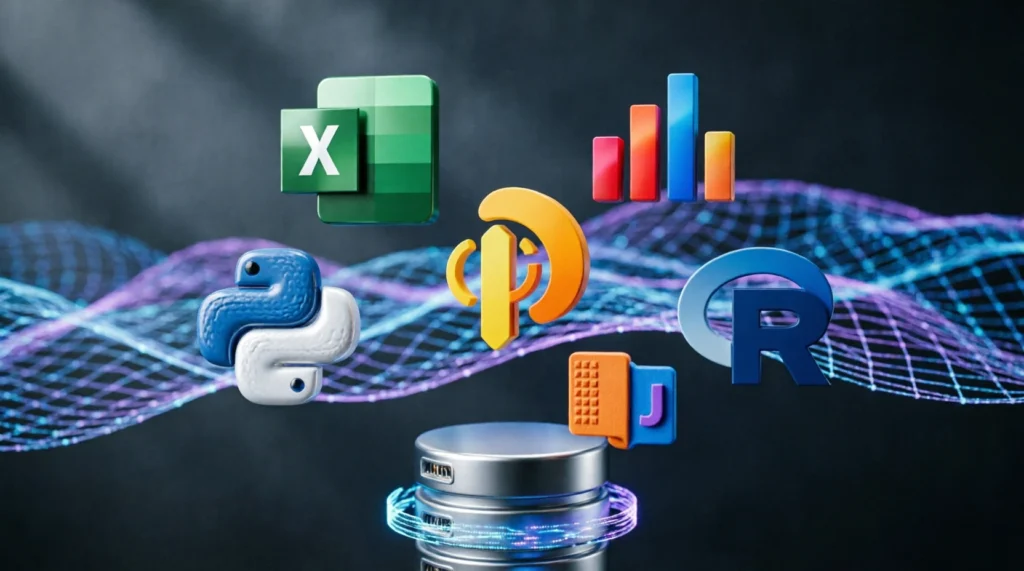
The Ultimate Guide to Data Analysis Tools: Find the Right Fit for Your Business in 2026
Let me guess — you’re drowning in data but starving for insights. You’ve got spreadsheets multiplying like rabbits, customer feedback piling up, and dashboards that nobody actually looks at. Sound familiar?
You’re not alone. According to recent industry reports, the average enterprise generates over 200 terabytes of data daily. But here’s the brutal truth: most of that data just sits there, collecting digital dust, because teams don’t have the right tools to make sense of it.
That’s exactly why choosing the right data analysis tools isn’t just a nice-to-have anymore. It’s a survival skill.
Whether you’re a small business owner trying to understand your sales trends, a marketing manager looking to optimize campaign spend, or a data analyst hunting for your next favorite piece of software — this guide has you covered. We’re going to break down everything you need to know about data analysis tools, compare the top options on the market, and help you walk away with a clear action plan.
Grab a coffee. Let’s dive in.
What Are Data Analysis Tools, Exactly?
Before we start throwing product names around, let’s get on the same page about what we’re actually talking about.
Data analysis tools are software applications and platforms designed to collect, process, clean, analyze, and visualize data. They take raw, messy, often overwhelming information and transform it into something humans can actually understand and act on.
Think of it like this: raw data is an unorganized warehouse. A data analysis tool is the system of shelves, labels, and forklifts that turns that chaos into something you can navigate and use.
These tools range from the painfully simple (yes, Excel still counts) to the breathtakingly complex (looking at you, Apache Spark). Some are built for total beginners. Others require a computer science degree and a strong tolerance for caffeine.
The key thing to remember is that there’s no single “best” data analysis tool. The right choice depends on your goals, your team’s skills, your budget, and the scale of data you’re working with.
Why Data Analysis Tools Matter More Than Ever
You might be thinking, “We’ve been analyzing data for decades. Why is this such a big deal now?”
Great question. Here’s why the conversation around data analysis tools has shifted from optional to essential:
1. Data Volume Has Exploded
Every click, purchase, scroll, and customer interaction generates data. The sheer volume makes manual analysis not just impractical — it’s impossible. You need tools that can process millions of rows without breaking a sweat.
2. Speed Equals Competitive Advantage
Your competitors are making decisions in real time. If you’re still waiting for end-of-month reports to figure out what’s working, you’re already behind. Modern data analysis tools let you spot trends, anomalies, and opportunities as they happen.
3. Everyone Needs Data Now — Not Just Data Teams
Marketing, sales, HR, finance, operations — every department needs access to data insights. Today’s data analysis tools have become more user-friendly, with drag-and-drop interfaces and natural language queries that don’t require coding skills.
4. AI Is Changing the Game
Artificial intelligence and machine learning have been woven into data analysis tools, enabling predictive analytics, automated anomaly detection, and even natural language questioning. The tools are getting smarter, and so are the people using them.
Key Features to Look for in Data Analysis Tools
Not all data analysis tools are created equal. Before you commit to one (or three), here are the features that actually matter:
- Ease of Use: Can your team pick it up without a six-month training program? If not, adoption will stall.
- Scalability: Will this tool still work when your data volume 10x’s? Think ahead.
- Integration Capabilities: Does it connect with your CRM, ERP, marketing platforms, and databases? Siloed data is useless data.
- Visualization Options: Charts, graphs, heatmaps, dashboards — good data analysis tools make insights visually compelling and easy to share.
- Collaboration Features: Can your team comment, share, and co-edit? Data insights should be a team sport.
- Data Cleaning & Preparation: Raw data is messy. The best tools help you clean, merge, and transform data before analysis even begins.
- Security & Compliance: Especially important if you’re handling customer data. Look for GDPR compliance, role-based access, and encryption.
- Cost & Pricing Model: Free tier? Per-user pricing? Enterprise contracts? Make sure the pricing aligns with how your team actually works.
The Best Data Analysis Tools in 2025 (Detailed Breakdown)
Alright, this is the section you came for. Let’s walk through the most popular and powerful data analysis tools available today, broken down by category.
📊 Spreadsheets: The Underrated Workhorses
Microsoft Excel
Love it or hate it, Excel remains one of the most widely used data analysis tools on the planet. It’s versatile, familiar, and surprisingly powerful when you know how to use pivot tables, VLOOKUP, Power Query, and basic macros.
Best for: Small datasets, quick ad-hoc analysis, financial modeling, and teams that already live in Microsoft 365.
Limitations: It struggles with very large datasets (anything over a million rows becomes painful), version control is a nightmare, and collaboration can get messy.
Google Sheets
The cloud-native cousin of Excel. It’s free, collaborative in real time, and integrates beautifully with other Google Workspace apps. Great for teams that need to work together on shared datasets.
Best for: Small to mid-sized teams, collaborative projects, and lightweight data tasks.
📈 Business Intelligence & Visualization Platforms
Tableau
If you want your data to look stunning, Tableau is a top-tier choice. It’s a powerhouse for data visualization, offering an intuitive drag-and-drop interface that lets you create interactive dashboards without writing a single line of code.
Best for: Data visualization enthusiasts, business analysts, and teams that need to present insights to stakeholders.
Things to know: Tableau has a learning curve, and licensing costs can add up quickly. But for serious visualization work, it’s hard to beat.
Microsoft Power BI
Power BI has surged in popularity, especially among organizations already using the Microsoft ecosystem. It connects to hundreds of data sources, offers robust dashboarding capabilities, and includes AI-powered features like natural language Q&A.
Best for: Microsoft-centric organizations, mid-sized to enterprise teams, and users who want strong BI capabilities at a relatively affordable price point.
Things to know: The free version is surprisingly capable. The Pro and Premium tiers unlock collaboration and enterprise features.
Looker (by Google Cloud)
Looker takes a unique approach with its proprietary modeling language called LookML. It’s designed for teams that want a single source of truth for their data, with governed, reusable metrics across the organization.
Best for: Data teams in tech companies, organizations with strong data engineering foundations, and teams that value consistency in metrics.
Qlik Sense
Qlik’s associative engine is its secret weapon. Unlike traditional query-based tools, Qlik Sense lets you explore data freely, discovering hidden connections and relationships that rigid query tools might miss.
Best for: Exploratory data analysis, organizations with complex data relationships, and teams that want to empower non-technical users.
💻 Programming-Based Data Analysis Tools
Python
Python has become the lingua franca of data analysis and data science. With libraries like Pandas, NumPy, Matplotlib, Seaborn, and Scikit-learn, you can do everything from data cleaning to machine learning — all in one language.
Best for: Data scientists, analysts comfortable with coding, and teams doing advanced statistical analysis or predictive modeling.
Things to know: The learning curve is real. But once you’re comfortable with Python, your analytical capabilities are virtually unlimited. Plus, it’s free and open source.
R
R was built specifically for statistical computing and data visualization. It’s beloved in academia, research, and any field where statistical rigor matters. Packages like ggplot2 for visualization and dplyr for data manipulation make R incredibly powerful.
Best for: Statisticians, researchers, and anyone doing heavy statistical analysis or academic work.
Things to know: R has a steeper learning curve than Python for general-purpose tasks, but for pure statistics, it’s a specialist’s dream.
SQL
Not a “tool” in the traditional sense, but SQL (Structured Query Language) is the backbone of data analysis. If your data lives in a database, you need SQL to extract and manipulate it. Every serious data analyst should know at least basic SQL.
Best for: Querying relational databases, data extraction, and building the foundation for more advanced analysis.
🧪 Advanced & Enterprise Data Analysis Tools
SAS
SAS has been a heavyweight in enterprise analytics for decades. It’s especially dominant in healthcare, pharmaceuticals, finance, and government — industries where regulatory compliance and audit trails matter enormously.
Best for: Large enterprises, regulated industries, and teams that need enterprise-grade security and reliability.
Things to know: SAS is expensive. Very expensive. But for organizations that need its specific strengths, there’s often no substitute.
Apache Spark
When your data is too large for a single machine, Apache Spark comes to the rescue. It’s an open-source distributed computing framework that processes massive datasets across clusters of computers at incredible speed.
Best for: Big data processing, real-time analytics, and organizations with dedicated data engineering teams.
KNIME
KNIME is an open-source platform that uses a visual, node-based interface for data analysis. You build workflows by dragging and connecting nodes — no coding required (though you can add custom code if you want).
Best for: Teams that want a visual approach to data pipelines, ETL processes, and reproducible analytics workflows.
RapidMiner
Similar to KNIME, RapidMiner offers a visual workflow builder but with a stronger emphasis on machine learning and predictive analytics. It also includes a marketplace of extensions.
Best for: Teams blending data preparation, machine learning, and deployment into a single platform.
📓 Notebooks & Exploratory Tools
Jupyter Notebook
Jupyter is the go-to environment for exploratory data analysis in Python and R. It lets you combine code, visualizations, and narrative text in a single document — perfect for experimentation and sharing your analytical process.
Best for: Data scientists, researchers, and anyone who values documenting their analytical thought process alongside their code.
How to Choose the Right Data Analysis Tool for Your Needs
With so many options, decision paralysis is real. Here’s a practical framework to help you narrow it down:
Step 1: Define Your Use Case
Are you doing basic reporting? Predictive modeling? Real-time monitoring? Customer segmentation? Your primary use case should drive your tool selection, not the other way around.
Step 2: Assess Your Team’s Skills
Be honest about your team’s technical capabilities. If nobody on your team knows Python, buying a Python-heavy tool won’t magically create skilled coders. Start where you are.
Step 3: Consider Your Data Infrastructure
Where does your data live? In a cloud data warehouse? An on-premise SQL server? CSV files scattered across shared drives? Your data analysis tools need to connect to wherever your data actually resides.
Step 4: Budget Realistically
Factor in not just the license cost, but training, implementation, and maintenance. A “free” tool that requires a $150,000/year data engineer to manage isn’t actually free.
Step 5: Test Before You Commit
Most reputable data analysis tools offer free trials or free tiers. Use them. Run real data through them. See how your team actually interacts with the tool, not just how it looks in a sales demo.
Free vs. Paid Data Analysis Tools: What’s Really Worth Paying For?
This is one of the most common questions I hear, so let’s address it head-on.
When Free Tools Are Enough
- You’re working with small datasets (under 100,000 rows)
- You’re a solo analyst or a very small team
- You’re in the learning phase and exploring what data analysis looks like for your business
- Your use case is straightforward (basic charts, pivot tables, simple dashboards)
Top free data analysis tools: Excel (if you already have Office), Google Sheets, Python with open-source libraries, KNIME, and the free tier of Power BI.
When It’s Time to Pay
- You need real-time dashboards with automatic data refresh
- You’re managing sensitive customer data and need enterprise-grade security
- You need role-based access controls for large teams
- You want dedicated customer support and SLAs
- Your data volume exceeds what free tools can handle
Worth paying for: Tableau, Power BI Pro/Premium, Looker, SAS, and managed cloud data warehouses that integrate with your analysis tools.
The bottom line? Start free, prove the value, and upgrade when the ROI justifies it.
Emerging Trends Shaping the Future of Data Analysis Tools
The landscape of data analysis tools is evolving fast. Here are the trends worth watching:
1. AI-Powered Analytics
Tools are embedding AI to automatically detect anomalies, suggest visualizations, and even generate insights in plain English. If you’ve used features like “Explain Data” in Tableau or the Q&A feature in Power BI, you’ve already seen this in action.
2. Natural Language Querying
Imagine asking your data, “What were our top-selling products last quarter in the Northeast?” and getting an instant chart. Natural language querying is becoming a standard feature, making data accessible to non-technical users.
3. Augmented Data Preparation
AI is also being used to automate the tedious work of cleaning and transforming data — detecting data types, suggesting joins, and flagging quality issues before you even start analyzing.
4. Embedded Analytics
Instead of pulling people into a separate BI tool, companies are embedding analytics directly into their existing applications. Think of a CRM that shows predictive lead scores right on the contact page.
5. Data Mesh and Decentralized Analytics
The idea of one central data team serving the entire organization is giving way to a “data mesh” approach, where domain teams own their data products. This is changing what organizations need from their data analysis tools — more governance, more self-service, more interoperability.
Common Mistakes to Avoid When Adopting Data Analysis Tools
I’ve seen enough tool adoptions go sideways to share a few cautionary tales:
❌ Buying the tool before defining the problem. A shiny new dashboard won’t fix unclear business questions. Start with what you need to know, then find the tool that answers it.
❌ Underestimating data preparation. People expect data analysis tools to magically handle messy data. They don’t. Budget time (and sometimes a separate tool) for cleaning and structuring your data.
❌ Ignoring adoption and training. The best tool in the world is useless if nobody uses it. Invest in training, create internal champions, and make the tool part of everyday workflows.
❌ Over-engineering your stack. You probably don’t need seven different data analysis tools. Start with one or two, get really good at them, and add complexity only when you’ve genuinely outgrown your current setup.
❌ Treating visualization as analysis. A pretty chart is not an insight. Make sure your team is trained to ask “so what?” after every visualization. What does this mean for the business? What should we do differently?
Frequently Asked Questions About Data Analysis Tools
What is the best data analysis tool for beginners?
For absolute beginners, Microsoft Excel and Google Sheets are the most accessible starting points. If you want to move beyond spreadsheets, Tableau Public (free) and Power BI Desktop (free) offer intuitive interfaces for building dashboards without coding.
What data analysis tools do data scientists use?
Data scientists typically rely on Python (with Pandas, NumPy, and Scikit-learn), R, SQL, and Jupyter Notebooks. For big data work, they may also use Apache Spark or cloud-based platforms like Databricks.
Are there free data analysis tools that are actually good?
Absolutely. Python and R are completely free and incredibly powerful. KNIME offers a robust free tier for visual analytics. Power BI Desktop is free for individual use. And Google Sheets is free and great for collaborative, lightweight analysis.
Do I need to know how to code to use data analysis tools?
Not necessarily. Tools like Tableau, Power BI, Looker, and KNIME are designed for non-coders with drag-and-drop interfaces. However, learning basic SQL or Python will dramatically expand what you can do with data.
How much do enterprise data analysis tools cost?
Costs vary widely. Power BI Pro starts around $10/user/month. Tableau Creator licenses run around $75/user/month. SAS and enterprise Looker deployments can cost tens or hundreds of thousands of dollars annually. Always request a custom quote for enterprise tools.
Can data analysis tools handle big data?
Some can, some can’t. Tools like Apache Spark, Databricks, and cloud-based solutions (BigQuery, Snowflake, Redshift) are specifically designed for big data. Traditional BI tools like Tableau and Power BI can connect to big data sources but typically rely on an underlying data warehouse to handle the heavy lifting.
What’s the difference between data analysis tools and data visualization tools?
Data analysis tools focus on processing, cleaning, transforming, and extracting insights from data. Data visualization tools focus on presenting those insights visually. Many modern platforms (Tableau, Power BI, Looker) do both, but the distinction still matters when evaluating specialized tools.
Putting It All Together: Your Next Steps
If you’ve made it this far, you’re probably feeling a mix of empowered and overwhelmed. That’s normal. The world of data analysis tools is vast, and it’s easy to get lost in comparisons and feature lists.
So here’s my honest advice:
Start small. Pick one tool that matches your current skill level and your most pressing business question. Get really comfortable with it. Build something useful — a sales dashboard, a customer churn report, a marketing attribution model — and share it with your team.
Then iterate. As your needs grow and your team’s confidence builds, layer in more advanced tools. Add Python for predictive modeling. Adopt a proper data warehouse. Introduce a governance framework. But don’t try to do it all at once.
The most successful organizations I’ve worked with didn’t start with the most sophisticated data stack. They started with a clear question, a willing team, and a tool that was just good enough to get started.
Data analysis tools are just that — tools. They amplify human curiosity and judgment. They don’t replace them. The real magic happens when skilled, thoughtful people use the right tools to ask better questions and make braver decisions.
Now go find yours. Your data is waiting.
If you found this guide helpful, bookmark it and share it with your team. The right data analysis tool could be the turning point your business needs this year. And if you have questions or want recommendations tailored to your specific situation, drop a comment below — we love talking data.